Programming Challenges - Ancient Messages
Earlier this year I wrote about Project Euler. I’ve kept up my problem solving, with an additional 23 Project Euler problems solved in the four months since I wrote that article. I’ve also tackled some problems from other sources that don’t have restrictions on me writing about them.

First up, I had a bash at one of the easier looking problems from this year’s ACM International Collegiate Programming Contest. You can see a description of the problem here on the UVA Online Judging website which provides automatic verification of submitted solutions.
The solver’s task for the problem I chose is to decode some “Ancient Messages”. So, how exactly did I do that?
The task given is to correctly identify hieroglyphs given in a bitmap. It didn’t take me long to spot that the thing that distinguishes the symbols from one another is the different number of holes they each have. All I needed to do was to find a way to work out which bits of image are hole, which are symbol, and which holes belong to which symbols. And, of course not get any of the holes confused with the background of the image which is the same colour.
I decided to use a Flood Fill Algorithm to work everything out. From my very earliest days of using a computer (a Sinclair ZX Spectrum) I remember watching the flood fill algorithm in action as it slowly filled in shapes drawn in the paint package. It’s like tipping a bucket of paint into an enclosed area and watching the paint spread out to fill the entire area, hence the name Flood Fill.
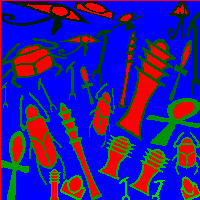
Step One is to use the Flood Fill to colour the background of the image. I chose Blue and decided to generate an actual image so I could make sure that my code was working properly. I used a very quick and dirty hack to add bmp file headers to the in-memory data and wrote the output to a file.
This visually proved a point that I’d suspected might be an issue that would need accounting for - if the symbols touch the edge of the canvas in more than one location then a single Flood Fill is not enough to reach all of the background regions. Luckily this was taken care of by the fact I’d already employed a favourite trick of mine for dealing with grids. That is, to add an extra border around the grid filled with background pixels. Normally I do this so that I don’t need to write code that needs to check for the edges of the grid. For example, if writing a game, and I know there is a wall around the playing field, then I never need to check that the character has ran off the screen, if I know he can’t run through walls. In this instance it meant if I started the flood in the border then I know it will touch all parts of the background touching the border.
Step Two, now that I’ve worked out which parts of the image belong to the background, is to work out which parts of the image are parts of the symbols. It’s all the black bits, but of course I need to be able to tell them apart. Again, I could use my Flood Fill code from Step One, starting from the first black pixel I found. When that fill completes I can start a new fill (with a different colour) starting from the next black pixel I find. You can see in my test images that I chose a range of shades of green for this step.
Step Three is very like Steps One and Two, which to me is one of the things which can make computer programming beautiful and elegant. I can re-use my flood fill algorithm again using the same process as for Step Two, only this time to find the holes in the shapes.
I added one tiny little modification to the fill algorithm - to make a note of the colour of any pixel it touches that isn’t the same colour as the area it is filling. This gives meaningless results in Steps One and Two, but in Step Three it tells us which shape the hole we’ve just filled belongs to.
Step Four - A simple case of totting up the numbers of holes and sorting and outputting the results. Easy!
Here is the Source Code, written in C++, warts and all, formatted and coloured using this handy syntax-colouring utility.
But Wait! - I submitted this to the judge and it turned out that this was one of the slowest running of the submitted entries. That’s a blow my manliness wasn’t going to take lightly, so I quickly got down to creating a version 2.0 to try to beat version 1.0’s time.
My experience of programming has been that usually the best way to improve a program’s performance is to fix the algorithm used. There are lots of little performance tweaks one can add, but typically they don’t help as much as getting a better algorithm helps. Assuming that such algorithm exists, of course.
I’d already put in a couple of favourite tweaks of mine - you might spot that at the start of readTestCase() I have removed the code that cleans up memory between test runs. Normally not a great idea, but in this case it is clear that all memory will be overwritten by the new data, so it’s a step we can skip. Like not bothering to paint your entire canvas background before starting because you know most of it will have foreground subjects on top.
However, the biggest improvement comes from realising that there is a lot of redundancy in the data. My v1.0 code is repeatedly stepping over pixels, yet looking at the data it is clear that pixels can come in long uninterrupted runs of a single colour. A common data compression algorithm for shrinking the file size of graphical data is something called Run Length Encoding. This is where instead of storing the same pixel several times over, we instead store the value of the pixel, followed by a number to say how many times that pixel is repeated.
I changed the code so that as it reads the data in, instead of writing it out into a pixel by pixel array, it counts up the numbers of pixels in horizontal runs and just stores those numbers. It took surprisingly little work to get the Flood Fill algorithm to work with the data in this format. The basic algorithm works in exactly the same way in the vertical direction, but in the horizontal direction gains massive increases in speed by not having to count up each pixel it sees. Instead it simply uses the counts of run lengths to work out at which points rows overlapped.
This code worked much faster than the initial version, although I was still able to add one last tiny tweak to squeeze some more speed out of it. That is, to take a short cut whenever processing input values of 0x0 or 0xF to add four to my pixel count, instead of having to work each one out. After this my score rose up to fifth place in the ranks.
Here is the improved v3.0 that achieved that placing. (Again, it could do with some tidying up to remove unused parts, but on the whole I think it is reasonably tidy. It gives a good impression of how the code looks as I am working on it.)
I suspect the online judge timings aren’t all that accurate as they don’t really match what I saw on my PC going from one version to the next. However, there is still a difference between my time and the top time on the table, so clearly a v4.0 will be needed if I want to get my name at the top of the list. Luckily I have a few ideas … I believe it may be possible to do away with all of the scanning and flood filling by turning the data into a graph as it is read in and counting connections in the graph.